Is the heatmap delayed?
Market views in a retail app can be delayed. Treat it as orientation, and confirm prints at your broker if you are about to trade.
PRODUCT — WATCH
A color map of the session: which sectors are working, which names are heavy, and where to click next.
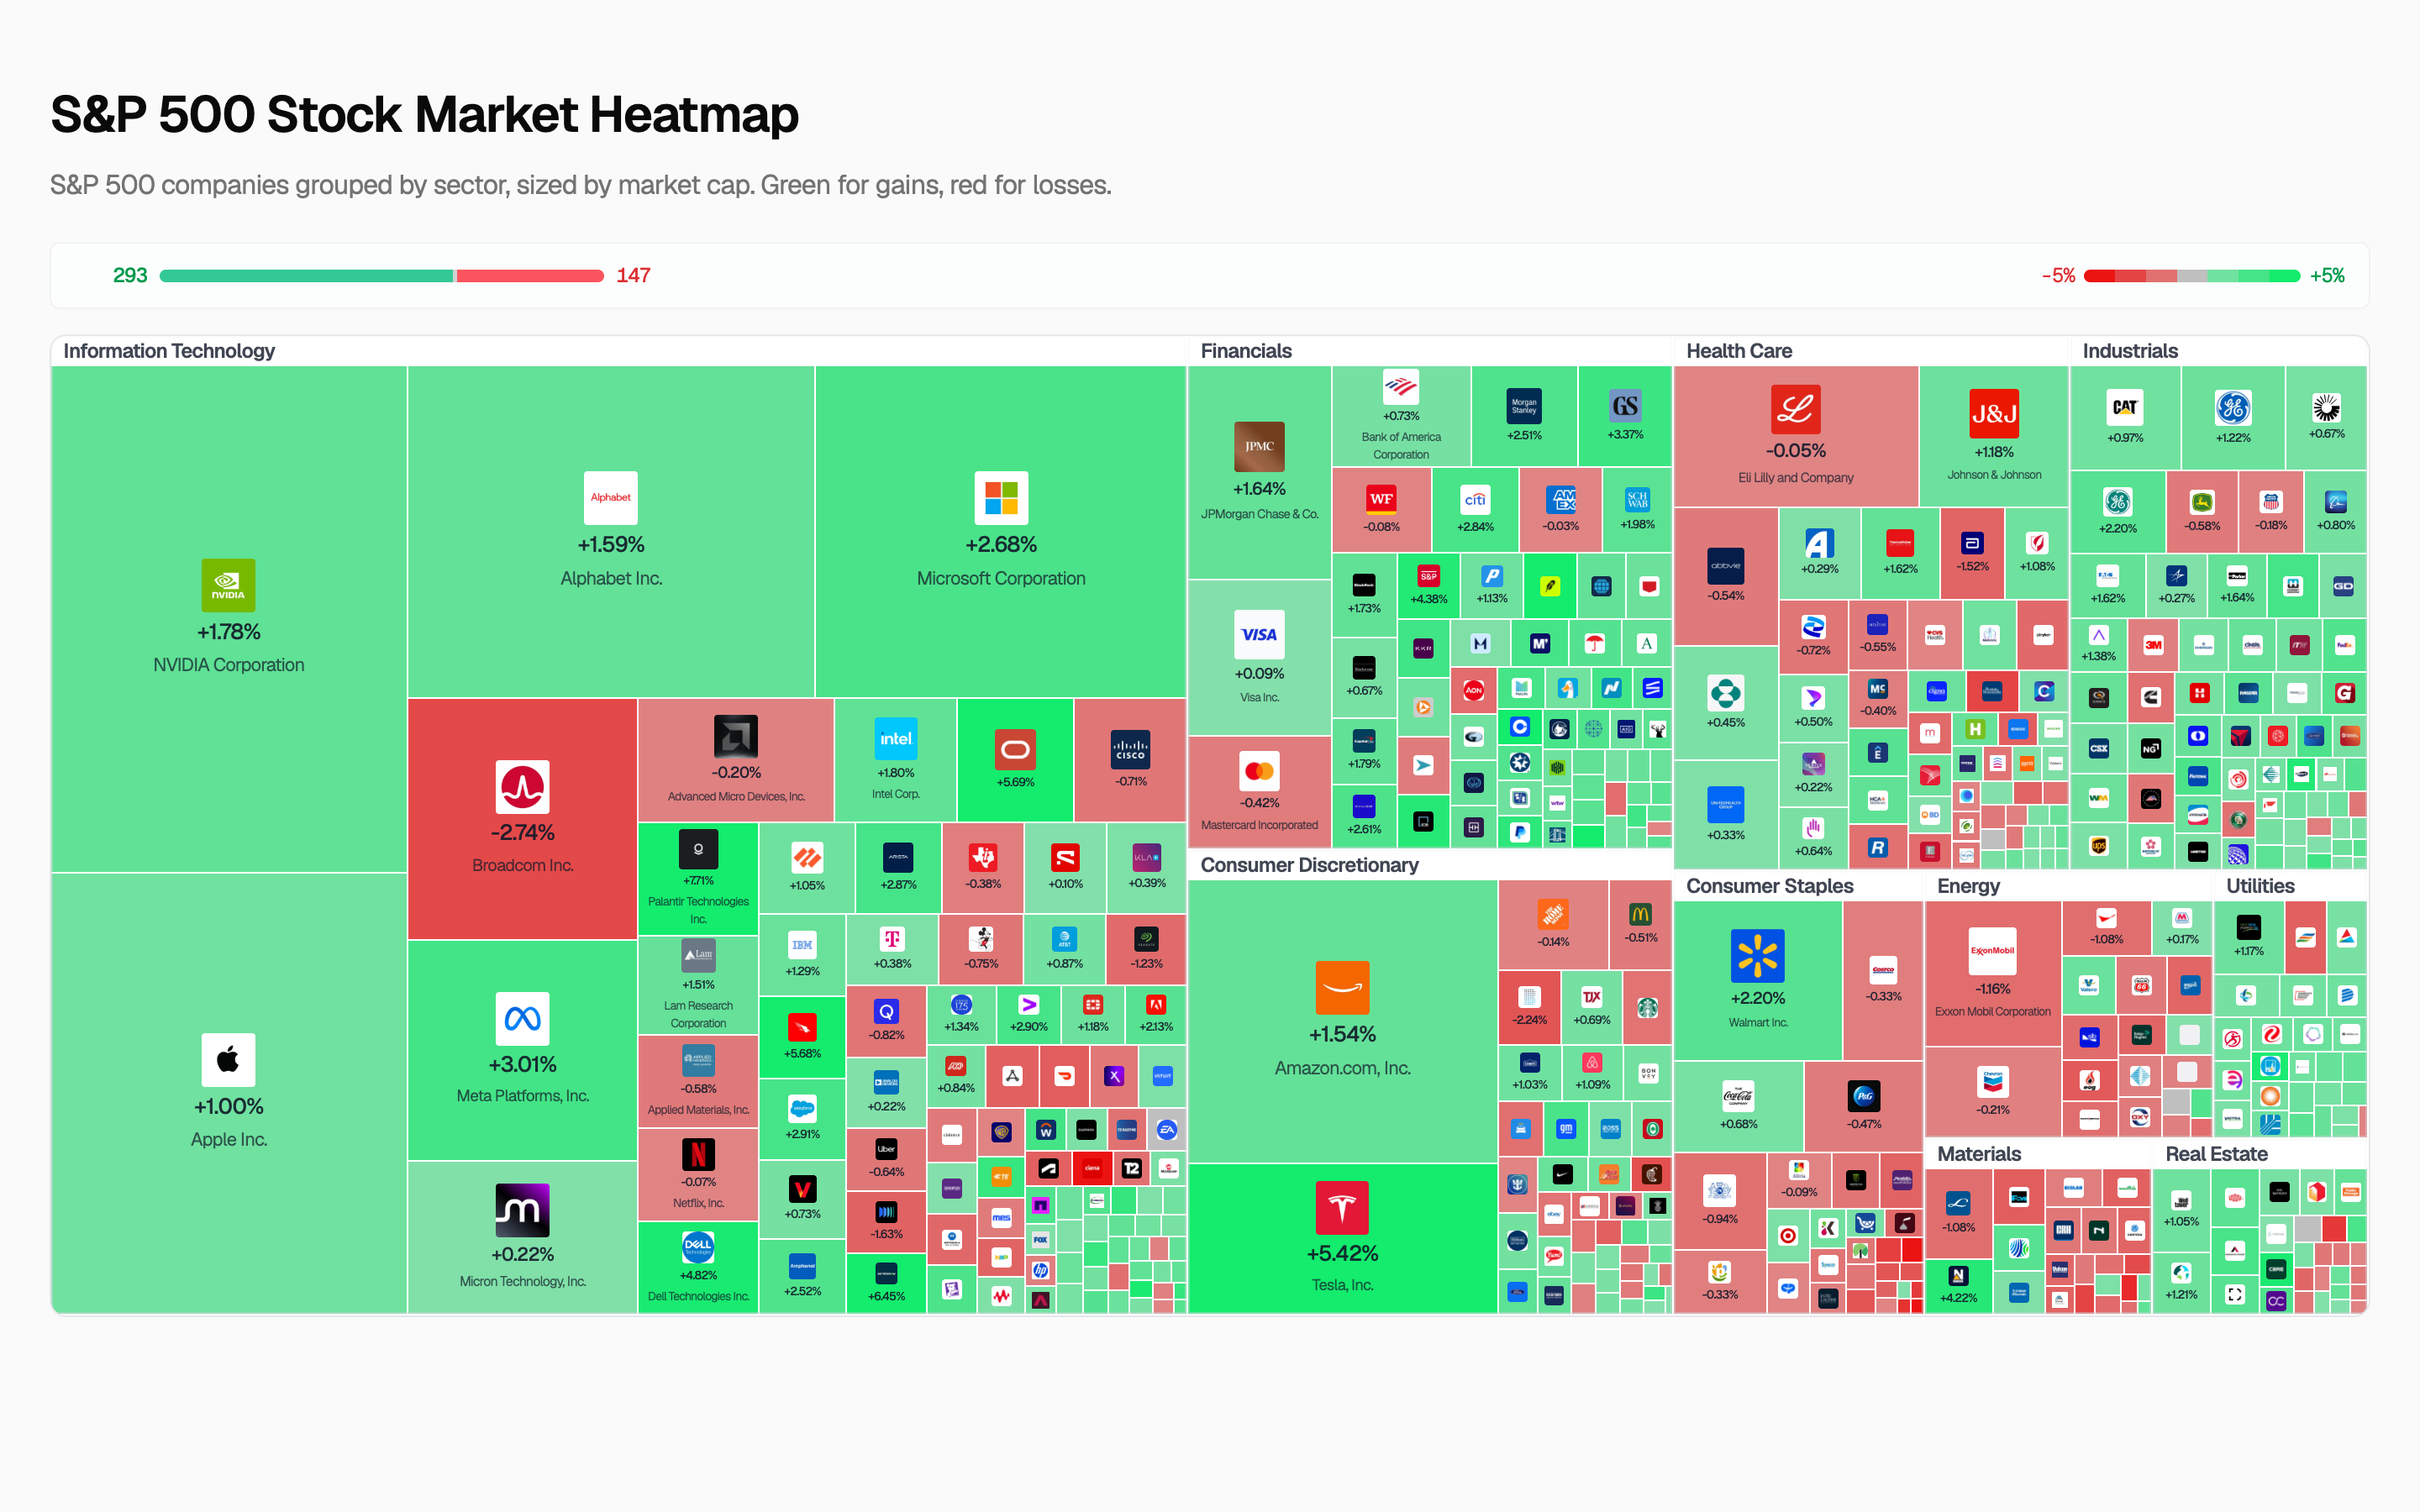
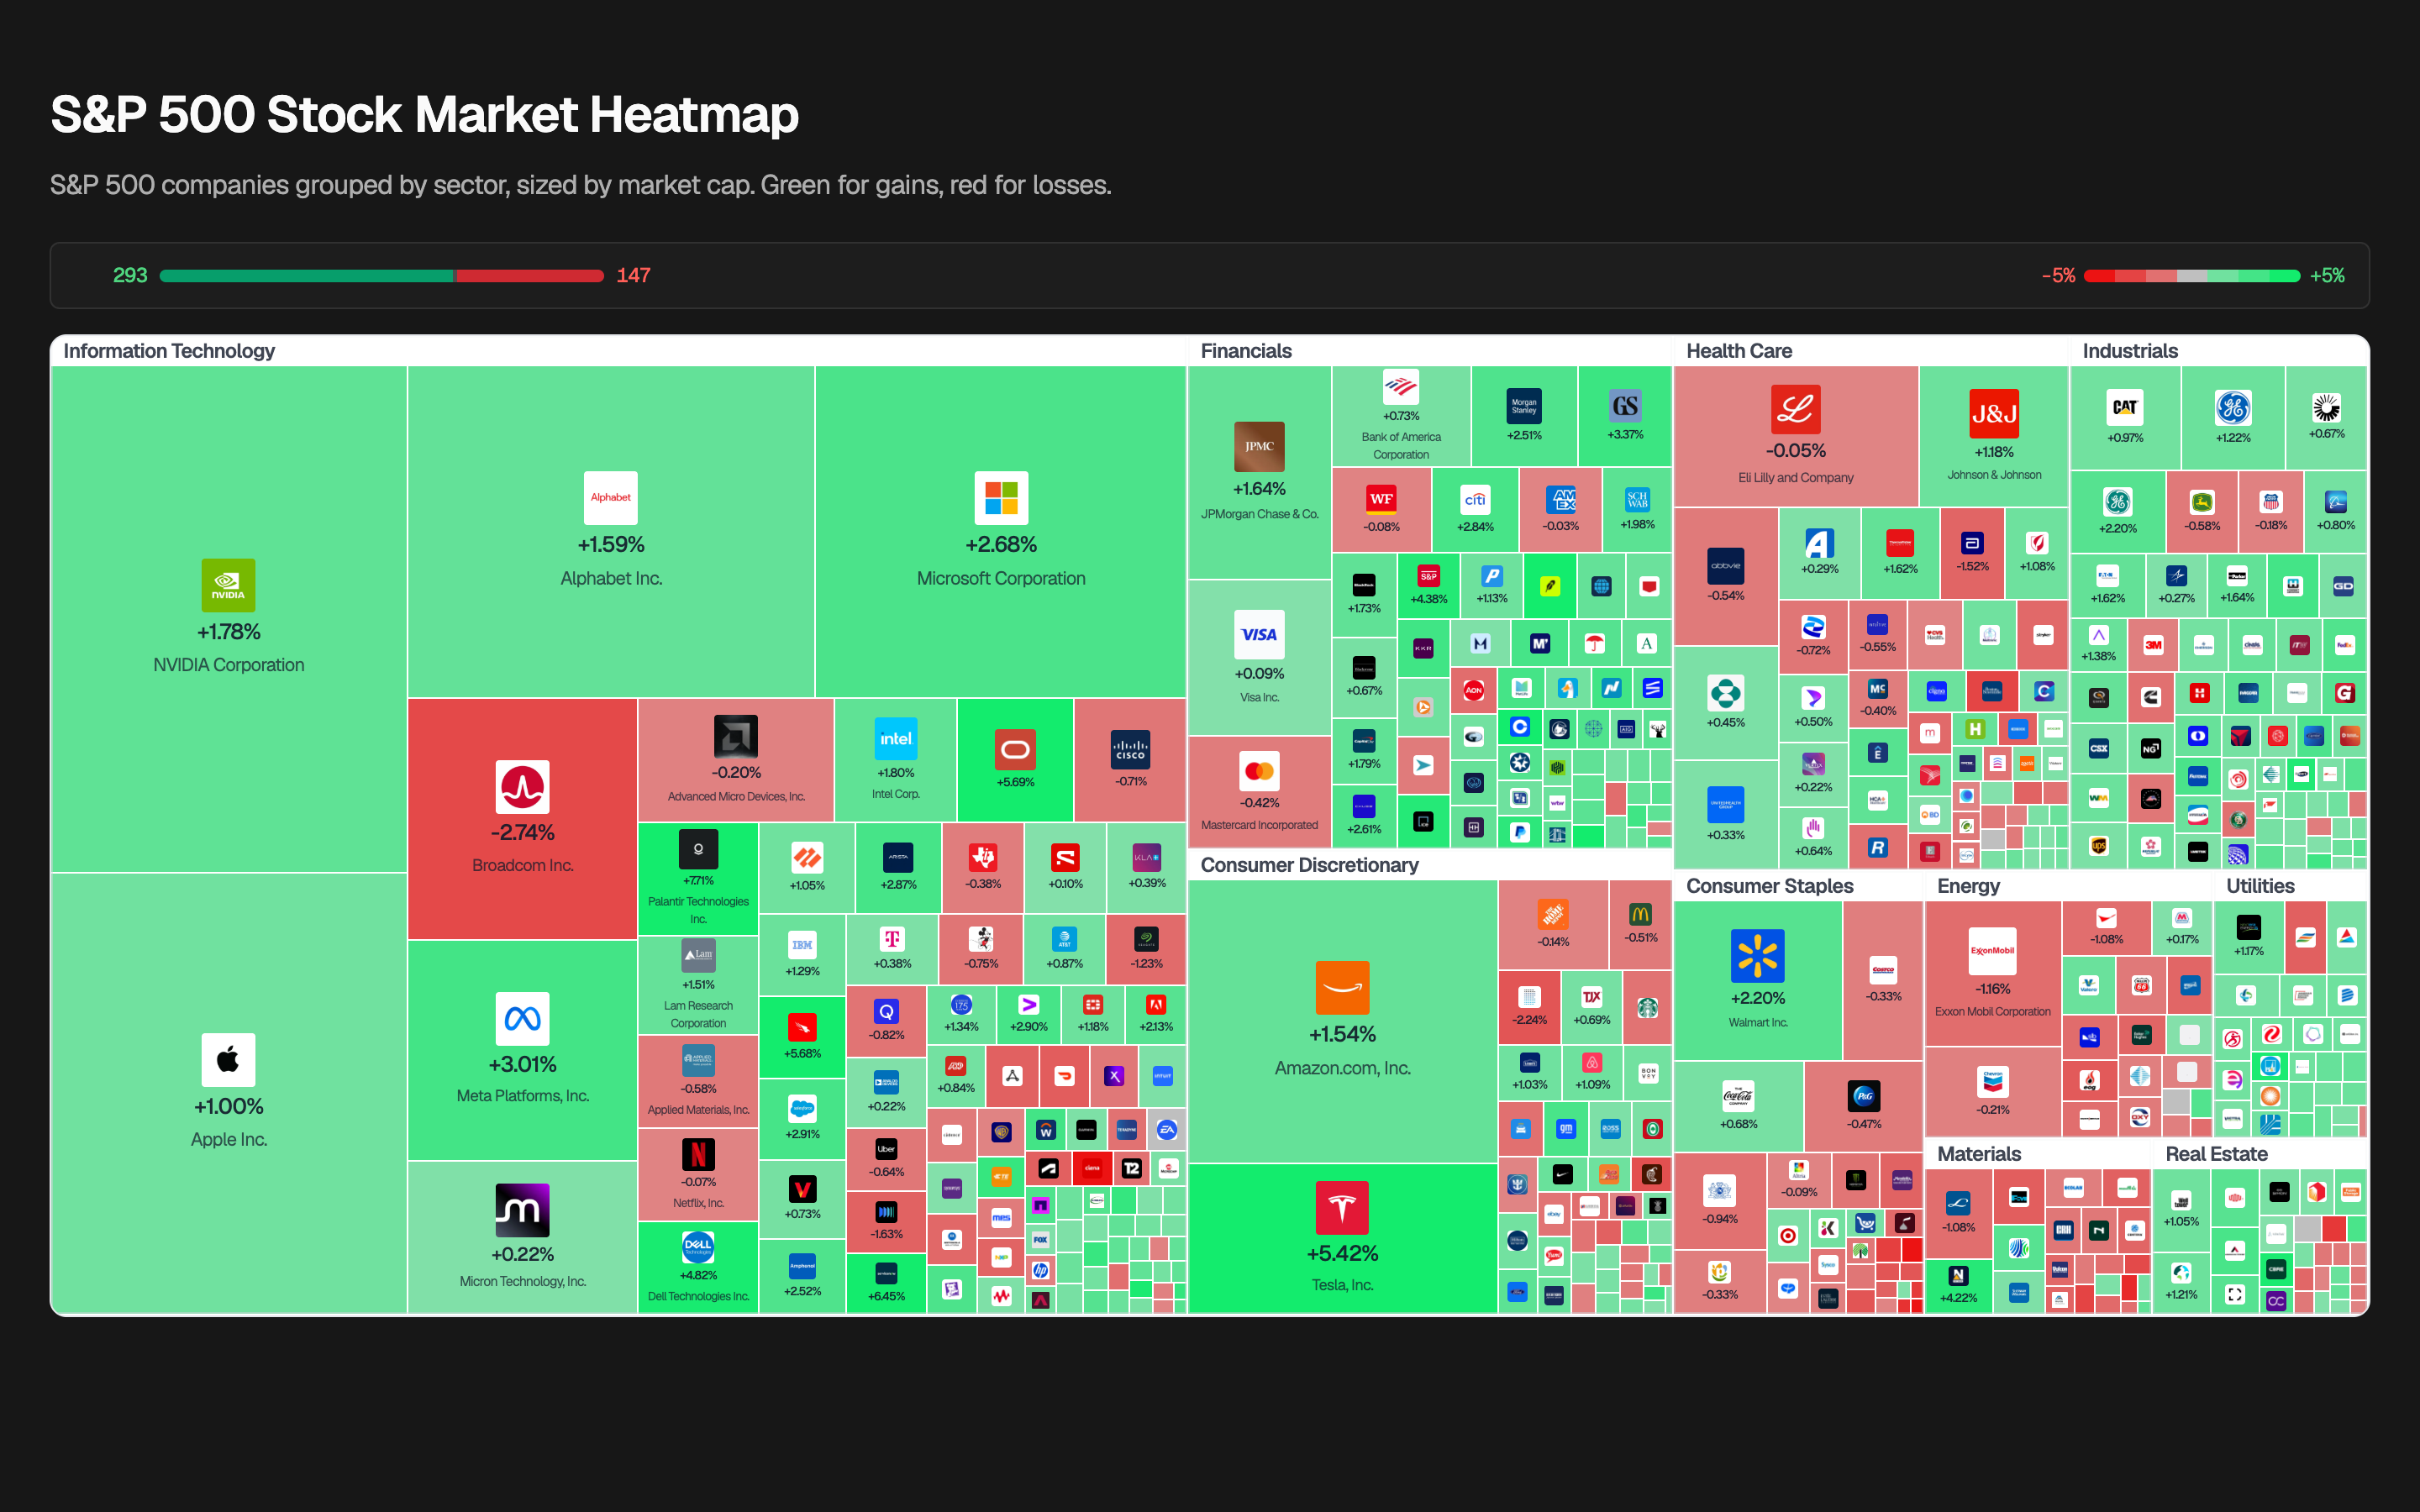
The heatmap is an S&P 500 treemap: companies grouped by sector, sized by market cap. Green and red blocks will not give you a thesis, but they will tell you whether the day is one sector or the whole tape.
From there you open a ticker, a recap, or the screener. The map is orientation, not a ranking product.
Use it after the recap or instead of a watchlist you have not thought about. One strong name can hide a weak sector. The map makes that harder to miss.
Color can be delayed in a retail app. Confirm prints at your broker if you are about to trade. Do not treat green as a recommendation.
Step 1
That is the only question the open needs. If everything is one color, the story is broader than a single ticker.
Step 2
A lone green block is an anecdote. A sector that is uniformly heavy is a reason to read the recap.
Step 3
Open the company page or news for a name you actually follow. The map is not a shopping list.
Step 4
Filter inside that industry instead of browsing the whole market because one rectangle was bright.
For people who need breadth in ten seconds before they spend an hour on a name.
A good fit if
The map answers that cheaper than a watchlist you built last year.
See whether the underlying names match the story you told yourself.
If you stop at the colors, you wasted the feature.
Not the right tool if
This is a performance map, not an index workshop.
Green is today's move. It is not a signal to buy.
One strong name can hide a weak sector. The map makes that harder to miss.
The useful part of a heatmap is the next page: the company, the news, or the recap.
Use it with the daily recap when you want the picture and the paragraph.
Color is a relative view of the session, not a forecast.
See which sectors are in charge before you read a watchlist.
Check whether a story stayed in one industry or bled into the rest of the tape.
If you own a sector fund, see whether the underlying map matches the story you told yourself.
Pick a strong or weak pocket, then filter names in the screener instead of browsing at random.
Market views in a retail app can be delayed. Treat it as orientation, and confirm prints at your broker if you are about to trade.
No. It is a performance map, not an index workshop.
No. Color is today's move, not a recommendation.
No. Ryxel is a research and tracking tool. It does not recommend trades, manage money, or act as a broker or registered investment adviser. You decide what to do with the information.
Create an account to use signals, recaps, news, and company research on the names you care about.
Ryxel is a research tool. It is not financial advice, a broker, or an investment adviser.